Dear Yuhao,
First, regarding the screenshot you sent:
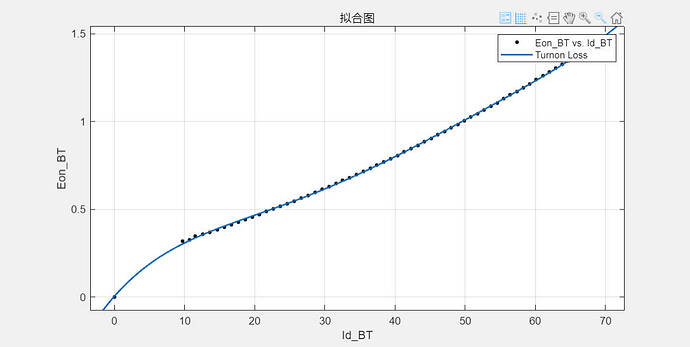
If this represents turn-on data at 800 V and 25 °C, and the y-axis is in mJ, then it appears to be quite similar. However, it seems you’re working with a different dataset than the one used in PLECS. As a result, the total losses differ, which makes it impossible to pinpoint the exact source of the discrepancy. For this reason, it’s crucial to always begin with the same data set to ensure a meaningful comparison.
Additionally, your fitting function seems to generate values between 0 and 10 A that are not present in the original data—at least based on what has been provided. This could introduce misleading artifacts and should be addressed.
PLECS uses 3D lookup tables for modeling turn-on and turn-off losses. The loss energy is computed as a function of current, voltage, and temperature:
Eon = f(v, i, T).
All interpolation is performed directly within these 3D lookup tables.
I’ve attached a test model that can be used to evaluate the switching and conduction losses within PLECS. In the relevant subsystem, you can define the thermal description, which internally passes the data to the 3D and 2D lookup tables (you can press Ctrl+U to look beneath the mask). The block takes current, voltage, and temperature as inputs, and outputs the switching and conduction losses.
Note: This block is intended for validation purposes only and should not be used in
simulations.
thermal_validation.plecs (18.6 KB)
C3M0120090D_tutorial.xml (2.9 KB)
Suggested Workflow:
To ensure consistent and meaningful comparisons between your script and PLECS, I recommend the following steps:
- Start with a simple model
Use a minimal example that includes only one switching device. I used the buck converter from the tutorial referenced earlier for this purpose.
- Use identical input data
Ensure that both PLECS and your script use the same current, voltage, and temperature values.
- Start with a known reference point
Perform loss calculations for a defined operating point (e.g., 400 V, 15 A, , 25 °C) to establish a baseline.
- Verify 1D interpolation
Change only one parameter (e.g., vary the current to 10 A while keeping voltage and temperature fixed at 400 V, 25 °C). This simplifies validation and makes it easier to manually assess interpolation behavior.
- Repeat step 4 for other parameters
Individually sweep voltage or temperature while holding the others constant.
- Test 2D interpolation
Fix one parameter and sweep the remaining two. This allows you to assess two-dimensional interpolation consistency.
- Test full interpolation behavior
Choose a point where all three parameters (v, i, T) are set to values not explicitly contained in the original dataset. This helps evaluate how both models behave under full interpolation conditions.
By systematically following these steps, you should be able to pinpoint where any differences between your script and PLECS originate.
Best regards,
Reto
